Going Down With The Ship

Status
Not open for further replies.
JFR, these pics are great. (y)The last one in summer '63 (love the Evinrude) you say the level was 3380 or so....on the lake Powell database it doesn't list 1963's levels, just 3409. Not to give you more work.....but is there a place where those '63 levels, after bypass tunnels were closed, were tracked in '63? :unsure: Mahalo!
You're right--the first listed elevation on the database is 3409 on 12-28-63. What about the rest of 1963? As it happens you're lucky that I already did that work a while ago. By using the inflow/outflow data on the database (which goes back to 3-14-63) and the USBR's 2022 Area and Capacity Table report, you can reconstruct the rise of the lake in 1963. In short, it goes something like this:

Before the dam - 3132 or so (at the damsite)

4-1-63 - 3234
5-1-63 - 3275
6-1-63 - 3337
7-1-63 - 3370
8-1-63 - 3373
9-1-63 - 3384
10-1-63 - 3396
11-1-63 - 3400
12-1-63 - 3407

Now you can get a lot more granular on a day to day basis, but that gives you a pretty good overall picture of that year... bottom line is that it hit dead pool by early July and rose very slowly the rest of the year, way slower than USBR expectations. That's because 1963 was a pretty bad runoff year...
 
Last edited:
You're right--the first listed elevation on the database is 3409 on 12-28-63. What about the rest of 1963? As it happens you're lucky that I already did that work a while ago. By using the inflow/outflow data on the database (which goes back to 3-14-63) and the USBR's 2022 Area and Capacity Table report, you can reconstruct the rise of the lake in 1963. In short, it goes something like this:

Before the dam - 3132 or so

4-1-63 - 3234
5-1-63 - 3275
6-1-63 - 3337
7-1-63 - 3370
8-1-63 - 3373
9-1-63 - 3384
10-1-63 - 3396
11-1-63 - 3400
12-1-63 - 3407

Now you can get a lot more granular on a day to day basis, but that gives you a pretty good overall picture of that year... bottom line is that it hit dead pool by early July and rose very slowly the rest of the year, way slower than USBR expectations. That's because 1963 was a pretty bad runoff year...
Wow....such interesting perspective.......Again, many thanks! (y)

You say: "way slower than USBR expectations" which is obviously accurate......makes us think about current USBR expectations.....:unsure:

Again, such are mid winter/ pre runoff ponderings

You're a treasure, JFR....(y)
 
You're right--the first listed elevation on the database is 3409 on 12-28-63. What about the rest of 1963? As it happens you're lucky that I already did that work a while ago. By using the inflow/outflow data on the database (which goes back to 3-14-63) and the USBR's 2022 Area and Capacity Table report, you can reconstruct the rise of the lake in 1963. In short, it goes something like this:

Before the dam - 3132 or so (at the damsite)

4-1-63 - 3234
5-1-63 - 3275
6-1-63 - 3337
7-1-63 - 3370
8-1-63 - 3373
9-1-63 - 3384
10-1-63 - 3396
11-1-63 - 3400
12-1-63 - 3407

Now you can get a lot more granular on a day to day basis, but that gives you a pretty good overall picture of that year... bottom line is that it hit dead pool by early July and rose very slowly the rest of the year, way slower than USBR expectations. That's because 1963 was a pretty bad runoff year...
JFR, if the lake sits in the 3470 range in the worst case 24 month prediction scenario what percentage of full pool would that represent? I think right now we are at about 27%. Just trying to get a sense of how quickly we can rise and fall at the lower levels. I’ve always been amazed how quickly they could get to power pool once they started controlling the flow. I think if there was consensus or requirements to do the same again, that storing water was vital, that we could rise very quickly again.
 
Last edited:
JFR, if the lake sits in the 3470 range in the worst case 24 month prediction scenario what percentage of full pool would that represent? I think right now we are at about 27%. Just trying to get a sense of how quickly we can rise and fall at the lower levels. I’ve always been amazed how quickly they could get to power pool once they started controlling the flow. I think if there was consensus or requirements to do the same again, that storing water was vital, that we could rise very quickly again.
You're right--things can go up and down fast with small volume changes when the lake is low. Here's the difference in surface elevation for live volume storage if and when the lake drops from here:

6.0 maf - 3533 (today)
5.5 maf - 3525
5.0 maf - 3515
4.5 maf - 3506
4.0 maf - 3495
3.0 maf - 3484
2.5 maf - 3473
2.0 maf - 3460
1.5 maf - 3446
1.0 maf - 3430
0.5 maf - 3413
0.0 maf - 3370 (dead pool)

Keep in mind that at dead pool there would still be about 1.7 maf stored in Lake Powell, but there is currently no mechanism to send it through the dam. Hence "dead" pool.

If the lake were at 3370, and sedimentation wasn't an issue, the lake would still extend to about Crystal Springs Canyon, and to Desha Canyon in the San Juan. That's where the lake stood in July 1963. But because of all the dirt deposited since 1963, the lake's extent would now be somewhat less, especially in the San Juan...
 
Real dumb question here,,,
What happened downstream of Glen Canyon Dam when they cut the water off to start filling Powell in 63?
That's a great question. You first have to start with the fact that when Lake Powell started filling in early 1963 there was more water in storage in Lake Mead than we have today stored in Mead and Powell COMBINED. In April 1963, Lake Mead held just under 22 maf, a reservoir mostly full. Today, Mead holds about 8.8 maf and Powell about 6 maf... less than 15 maf combined out of a collective capacity on the order of 50 maf.

So in 1963-64, there was a much greater cushion and a lot more flexibility on how to manage releases through Powell. And sure enough, Powell releases were pretty meager in those days in order to fill the lake. For most of 1963 and during the period May-August 1964, releases were on the order of 1000 cfs. What was the net effect downstream? As you might imagine, Lake Mead dropped quite a bit. By October 1963, Mead was down to 17.4 maf, and by October 1964 it had fallen to 11.6 maf. And yet, as low as that was, Mead still held more water than it does today. Water and power deliveries were never in danger.

Meanwhile, by October 1964, Powell was up to 4.2 maf. But note that in just 18 months (April 1963-Oct 1964), the collective volume of Mead and brand new Lake Powell had been reduced from 22 maf to just under 16 maf. That's because runoff in the winter of 1963-64 was so poor. It took a big 1965 for those numbers to rebound.

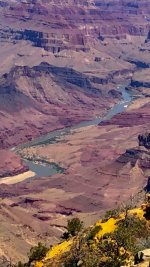
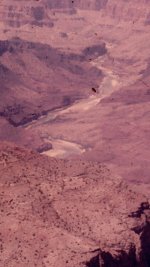
If you want to picture what a 1000 cfs release did downstream on the Colorado River, here's a couple of photos to compare. The first is a shot I took looking up Marble Canyon from Desert View in May 2023, when the outflow was about 18,000 cfs. The second is what my dad took from almost the exact same viewpoint in June 1964, when the river was at 1000 cfs (we were on a family vacation from Ohio when I was 18 months old). The 1964 photo is grainy and old, but you can see the huge difference. One wonders what it was like trying to run the river that summer....

Colorado River, in Marble Canyon
May 2023, 18,000 cfs

2023 May - Marble Canyon - 18,000 cfs.jpeg


Colorado River, in Marble Canyon
June 1964, 1,000 cfs

1964 June - Marble Canyon - 1,000 cfs.jpeg
 
I understand the emotions. We’ve had people meet, people propose, people get married on our boat. Our first grandchild took his first steps on the boat. I keep telling my daughters the only thing we haven’t had is a baby born on the boat. So far, no takers on that. I listened to some of our fellow owners share their memories and combined that with hundreds of our own. It’s been really special. We love exploring so lower levels mean something new and different, on the other hand, I’d sure like to get back up into 50 Mile canyon again someday. There are some real favorite spots we can no longer get to. Going to be interesting to see what the next few years bring
 
Status
Not open for further replies.
Back
Top