Fickle River
Well-Known Member
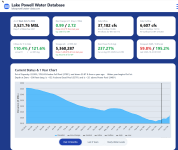
It’s like like a good spring runoff all over again. 


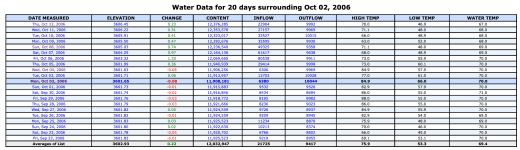
Are we in the range of record daily rise for October?

This current rain event will go on for a couple more days. The San Juan is flowing above 10K cfs at Bluff UT which is about 4 days of flow from Lake Powell. We should see about a foot rise for several more days. Since mid September, the Navaho reservoir has added just over 100K acre feet and Vallecito has added 50K. The fall rise will be at least twice as much as the spring melt. I wonder if that is a record.4th in the record book. Nice. But it's still raining and looks to be raining all day today!!! Do I here second place.???

Here's a little perspective. The 13,300 cfs reported for the San Juan at Bluff on October 22 is in the top 1% of all-time flows recorded on that river in the last century on any date. The only times flow has ever exceeded this in any October was in 1937, 1941, 1947, 1969 and 1972, and most of those were just single day events, twelve days in all...This current rain event will go on for a couple more days. The San Juan is flowing above 10K cfs at Bluff UT which is about 4 days of flow from Lake Powell. We should see about a foot rise for several more days. Since mid September, the Navaho reservoir has added just over 100K acre feet and Vallecito has added 50K. The fall rise will be at least twice as much as the spring melt. I wonder if that is a record.

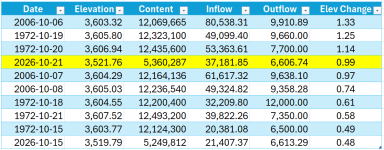
Thinking about this some more. 128,000 acre-feet in one day is crazy. That is a 1% increase in lake content in one day.Yesterday was "only" 0.34' from the record. But look at how much different the actual content changed.
Yesterday increased about 56,000 acre-feet. But that October 6, 2006 record increased 128,000 acre-feet.
There's a mystery to solve about that October 6, 2006 reading. The water database shows the inflow to Lake Powell that day to be 80,538 cfs. And yet, here's what the USGS shows for the flow that day just upstream along the three main sources of inflow:Thinking about this some more. 128,000 acre-feet in one day is crazy. That is a 1% increase in lake content in one day.
But that means 56,000 feet yesterday was ALSO a 1% increase, albeit from a much lower starting point.

 www.deseret.com

You're onto something there. Here were the flows on the Dirty Devil and Escalante:Escalante contributedEscalante Flood 2006 • Part III
www.canyontales.com
Dirty Devil contributedFlood damage devastating
Floods destroyed the only diversion dam and irrigation system serving rural farmers in Hanksville earlier this month, and now residents wonder if their town will ever be the same again.
The Escalante is measured well upstream from where all the flooding occurred. Where it actually entered the lake it was above 10k . See the pictures in the article.You're onto something there. Here were the flows on the Dirty Devil and Escalante:
Dirty Devil -
10-6-06 - 11,700 cfs
10-7-06 - 26,900 cfs (!!)
There's your major contributor...
But the Escalante peaked at only 291 cfs on 10-6-06, which is flood stage for sure, but not much help there by comparison. (FYI... the Escalante hit 1600+ cfs for a while today...)
Those photos are really impressive... what an ordeal in October 2006! Thanks for sharing!The Escalante is measured well upstream from where all the flooding occurred. Where it actually entered the lake it was above 10k . See the pictures in the article.