Reflecting on the Summer, and What's Ahead for Spring 2026?

JFRCalifornia

Keeper of San Juan Secrets
Now that we’ve got BOR's September 24-month study in, we have a pretty clear picture ahead of where the water levels are going to be next spring. Fall and winter inflows are always much more predictable than spring and summer, and BOR is not likely to change their outflow regime between now and spring. What this all adds up to is that we’ll almost certainly see the lake drop to about 3516, which is even lower than it dropped in April 2023, when it bottomed out at 3519. It wasn’t the end of the world then, and it won’t be this time either. But it is getting to the point where power generation in the winter and spring of 2027 is going to become an issue if we don’t have a wet winter this year. Let’s see where this goes.

It's also very interesting to consider how much the forecast changed for the worse in just the four months since April 2025, a time when we had a pretty clear picture of the snowpack and runoff potential. At that time, the “most probable” 24-month study forecast predicted that April-July unregulated inflow would be 4.3 maf, a pretty sizable if not spectacular spring/summer inflow. But now we see it turned out to be only 2.5 maf, or less than 60% of what they thought would be the case. It was such an outlier outcome that it was much less than even the “minimum probable” prediction in April, which forecast 3.1 maf. The “minimum probable” is the level at which 90% of the modeled outcomes would exceed, so this was a true outlier result, something that even the models could not come close to predicting.

It all begs the question: why did this happen?

I’m not going to speculate on an answer, since I don’t have the tools or the data to develop a credible hypothesis, but clearly, some of the assumptions inherent in the existing model with respect to converting snowpack to runoff are either no longer valid, or at least wildly offbase for this year. Seems like there’s a little more work to be done at NOAA and BOR to recalibrate...

To some extent, BOR buffered the full force of the impact of poor spring runoff by releasing more from the upper reservoirs to Lake Powell than originally planned for the summer. But that was a stopgap measure, and at the end of the day, we’re still looking at a likely drop of about 45 feet from the June 2025 summer peak to the bottom next spring. That’s a big drop.

For those who see things as “glass half full,” there are upsides to this, assuming you can still launch your boat somewhere on the lake. There are places that will be visible that are normally not, reemerging canyons to hike in, all that. And it will certainly prompt a little more urgency among the states to resolve the issues related to future water use under the Compact, because if they don’t, nature will undoubtedly resolve it for them…

But if you’re looking for a low water upside, it’s finding more places like this…

IMG_7762.jpeg
 
Last edited:
Great post and analysis as usual! Two comments:

1. A difference between April 2023 and April 2026 is that we now have the 2024 Supplement to the 2007 Interim Guidelines. Additionally we also now meet the criteria that invokes the biggest change in that supplement: the 24 Month Minimum Probable shows levels below 3490 in the future. Because of that BOR can now reduce outflows down to 6.0 maf. Their operating forecasts presently assume they stick to 7.48 maf. Will they change much between now and April? Probably not as you say, but they do have the option now.

2. We should be careful with statements like “clearly, some of the assumptions inherent in the existing model with respect to converting snowpack to runoff are either no longer valid, or at least wildly offbase for this year” just because we were below 90% of model outcomes (the “minimum probable”). We expect to be below that at least some years. In the past ten years we’ve missed that low twice rather than just once. Does that indicate a broken model? Well, no, because for any ten year period we expect to miss that low two or more years 26% of the time. Acusing the model of being broken because of a 26% probability outcome is like accusing your friend of using a trick coin because it came up heads twice in a row. It just isn’t remotely statistically significant. In general our intuition with probability is poor and phrases used by the modelers such as “minimum probable” don’t help us either!

Which isn’t to say the models aren’t probably lagging changes in the basin climate! I think everyone assumes they are to a degree and expect that will bias the forecasts high. But we should be careful when statistically insignificant events happen to fit a narrative we are building and potentially lead us into confirmation bias traps. The models might be off, but the results so far don’t actually give us any indication they actually are.
 
We should be careful with statements like “clearly, some of the assumptions inherent in the existing model with respect to converting snowpack to runoff are either no longer valid, or at least wildly offbase for this year” just because we were below 90% of model outcomes (the “minimum probable”). We expect to be below that at least some years. In the past ten years we’ve missed that low twice rather than just once. Does that indicate a broken model? Well, no, because for any ten year period we expect to miss that low two or more years 26% of the time. Acusing the model of being broken because of a 26% probability outcome is like accusing your friend of using a trick coin because it came up heads twice in a row. It just isn’t remotely statistically significant. In general our intuition with probability is poor and phrases used by the modelers such as “minimum probable” don’t help us either!
Great observations, and I especially appreciate your caution about drawing conclusions about the efficacy of the model and its underlying assumptions. Thanks for reining me in. Now I'm no statistician, but here's some interesting data to consider to help get to the bottom of this issue.

I wanted to see how closely the BOR's predicted collective unregulated inflow for the months of April through July were to the actual inflow during those four months, as measured after the fact. A few interesting things pop out.

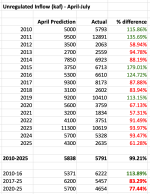
Here's the data, comparing the April prediction each year from 2010-25 with what actually happened, and the % difference:

Screenshot 2025-09-23 at 12.22.00 AM.png

So the first thing you notice is that if you look in the aggregate from 2010-25, the April predictions were almost exactly on the money with what actually happened during those 16 years--right around an average of 5.8 maf unregulated inflow from April-July. But then if you look more closely, there are really two stories here. From 2010-2016, the April predictions more often than not underestimated what actually happened--in the case of 2011 and 2015, they were very low. And yet, there were also three years where they overestimated (especially in 2012). But overall, you'd eyeball the 2010-16 data and say they were usually in the ballpark up or down, given normal variation.

Completely different story since 2017. In 8 of the 9 years starting in 2017, the April prediction overestimated what actually happened during the spring/summer runoff, and they were particularly far off the mark in 2020, 2021 and 2025. In most other years, they were consistently low by about 10-15%. Only in 2019 did they guess too low.

I'm not sure there's enough data points to draw any statistically significant conclusions from this, but to the casual eye, it sure feels like we're well into a trend--BOR has been consistently overestimating the inflow since 2017, often by a lot. Does this mean there's a problem with the model relative to shifting climate realities? Or is it just part of the expected ups and downs that happen over long periods of time? Hard to say. On the one hand, it's hard to ignore that from 2010-25 in aggregate, the predictions are overall pretty accurate. And yet...it's equally difficult to ignore the recent trends in the data that tell a totally different story...

I'll let others who spend more time with numbers chew on that one...
 
Last edited:
Great questions! I'll try to answer within my limited knowledge of the topics.

Why aren't the data and methodology just released?
They are. But it would take a lot of effort for anyone to do anything with them.

You'd think with AI advancements modeling would be getting pretty solid or at least improving.
AI is largely garbage for many kinds of modeling.

In general, AI works best when there are vast amounts of data with which to train it across a huge range of scenarios and for which the model parameters are consistent across that data. For things like short term weather forecasting where such data exists it is pretty good at this point, though rather than increased accuracy the bigger advantage is faster and more computationally efficient. Still, even in that regime it has really bad blind spots still because it can't predict extreme weather events worth a dang, whereas the physics based models do much better. Basically, AI weather models do a good job predicting a hot day and whether it will rain in a few days if that's all within the "normal" range for a day, but every time it thinks there will be a hurricane it will predict it is a category 2.

Worse still, AI models have extreme past and recency bias. So if the climate is actually changing it falls flat on its face, whereas physics based models adapt through changing climate much better (but are by no means perfect since parts of their models don't extrapolate well outside a given climate range, but at least they will attempt to extrapolate based on some physics while AI will usually just fail).

Now people can paste all sorts of exceptions around the AI models to try to make up for these shortcomings, but fundamentally it is often a flawed starting point. Likely over time people will stitch the two kinds of modeling together and AI will have a positive impact on accuracy, but so far not much luck.

But that's for short term weather, where there is massive amounts of input data and scenarios to run to train it (i.e. thousands of one week periods each with billions of data points). For longer term forecasting, like Colorado River run off for the coming spring, there is vanishingly few scenarios with little data. We have about a 100 springs of actual runoff data, so only 100 or so scenarios. Worse still, for the vast majority of those scenarios our data is almost zero - largely just what the runoff was approximately and what the snowpack was approximately (or not at all). Only recently do we start to have any useful inputs for the model, like more accurate snow pack, more accurate soil moisture, more accurate vegetation conditions, more accurate evaporative potential. So basically we don't even have a tiny fraction of what's required to train an AI model.

Is there scientific rigor, or a finger above or below the scale?
There is lots of scientific rigor in the models, but at some point weather forecasting largely doesn't care how much more rigor you put into it. That's the whole revelation of "chaos theory" from the middle of the 20th century. Thought in the 19th century was that a deterministic system could be accurately modeled and predicted with sufficient input data. Absolutely not true for dynamic non-linear systems it was eventually realized. Throw all the data and rigor at it that you want, you'll still be wrong most of the time. The best you can do is produce a statical range of likely outcomes and often that range is disturbingly large. That's what the current spring forecasts are doing, and they are doing it within their reported accuracy ranges.

Now, they are absolutely trying to add more parameters to the models as they are provided with more data and realize that new parameters might be important (e.g. recently there is more dust on the snow pack and that leads to higher evaporative losses). Problem is you can't just magically plug in a new data set, often it takes years to understand how to properly integrate new data sets into a model and then validate they are actually helping. If the climate is changing rapidly then you'll always be a bit behind the curve.
 
I'll let others who spend more time with numbers chew on that one...

Nice illustrative analysis as usual!

So is 2020-2025 statistically significant based on how you've presented the data? Well, that's a tricky one because each year's April forecast has a different uncertainty published with it. In 2023 the "minimum" was 81% of the forecast while in 2021 the "minimum" was 53% of the forecast. And then we like to combine things assuming Gaussian distributions and this is almost certainly not such a distribution, etc. etc. etc. And of course six is not a large number of samples!

That said, we can still do some simple approximations and number crunching that will probably make anyone who actually values statistics and probability to shed tears of blood...

We'd expect the variance to go down as we combine multiple years as you have. Doing some very sloppy math, over those six years the average of the "minimum probables" is 72% of the forecast. If we average together multiple years then we'd expect to get closer to the average of the forecasts, that is to say something higher than 72%. A very rough approximation would be about 89% (based on Gaussian distributions).

When we combined all six years as you did the actual result was only 77% of the forecast, less than our guesstimate of 89% for a lower bound. So that's already implying that this six year period's actuals is outside what we'd expect for an 80% confidence interval for combining six years of data (i.e. like the 10% to 90% forecast range the models report for each individual year).

So in that very naive statistical treatment it sure looks like the past six years combined were a "forecast miss" in the sense that we ended up significantly outside our computed 80% confidence interval.

Now of course the big flaw in all that is we did our statistical analysis assuming random independent trials, and we know climate very much is not at all like that (it does have longer term trends and thus correlation year to year). Which as you say, still leaves us guessing, is the "miss" just because we are in modest length period of conditions that the model doesn't forecast against well, or have we actually seen a more permanent or long term change in things such that the model if unmodified will continue to miss low on average?
That is some serious geek-ology! I love it!

Yes, it's indeed hard to ferret out any definitive conclusions with such a small sample size and the vagaries of forecasting... but I like your thinking on this one, and your "sloppy math" suggests this is an avenue worth investigating...

I'll have to run this all by my meteorologist brother who does this kind of thing for a living...
 
Great observations, and I especially appreciate your caution about drawing conclusions about the efficacy of the model and its underlying assumptions. Thanks for reining me in. Now I'm no statistician, but here's some interesting data to consider to help get to the bottom of this issue.

I wanted to see how closely the BOR's predicted collective unregulated inflow for the months of April through July were to the actual inflow during those four months, as measured after the fact. A few interesting things pop out.

Here's the data, comparing the April prediction each year from 2010-25 with what actually happened, and the % difference:

View attachment 33924

So the first thing you notice is that if you look in the aggregate from 2010-25, the April predictions were almost exactly on the money with what actually happened during those 16 years--right around an average of 5.8 maf unregulated inflow from April-July. But then if you look more closely, there are really two stories here. From 2010-2016, the April predictions more often than not underestimated what actually happened--in the case of 2011 and 2015, they were very low. And yet, there were also three years where they overestimated (especially in 2012). But overall, you'd eyeball the 2010-16 data and say they were usually in the ballpark up or down, given normal variation.

Completely different story since 2017. In 8 of the 9 years starting in 2017, the April prediction overestimated what actually happened during the spring/summer runoff, and they were particularly far off the mark in 2020, 2021 and 2025. In most other years, they were consistently low by about 10-15%. Only in 2019 did they guess too low.

I'm not sure there's enough data points to draw any statistically significant conclusions from this, but to the casual eye, it sure feels like we're well into a trend--BOR has been consistently overestimating the inflow since 2017, often by a lot. Does this mean there's a problem with the model relative to shifting climate realities? Or is it just part of the expected ups and downs that happen over long periods of time? Hard to say. On the one hand, it's hard to ignore that from 2010-25 in aggregate, the predictions are overall pretty accurate. And yet...it's equally difficult to ignore the recent trends in the data that tell a totally different story...

I'll let others who spend more time with numbers chew on that one...

One thing I noticed is that when they project a below-average runoff (less than 5791), 8 of the 11 times, the actual runoff was even lower. So it's as if when a low runoff year is likely, their model overpredicts (guesses too high) what the runoff will be. Unless it's a conscious decision to just use a prediction higher than the model spits out.
 
Last edited:
One thing I noticed is that when they project a below-average runoff (less than 5791), 8 of the 11 times, the actual runoff was even lower. So it's as if when a low runoff year is likely, their model overpredicts what the runoff will be. Unless it's a conscious decision to just use a prediction higher than the model spits out.
That's an accurate observation, but on the other hand you could also say that in 3 of the 5 years where they predicted less than what actually happened were also years they predicted "below average" inflow. So it seems that the variation goes in both directions...

I still keep coming back to the idea that in 8 of the last 9 years, they have overpredicted the spring/summer inflow, even when they had a pretty good idea of how much remaining snowpack they had right in front of them...
 
I still keep coming back to the idea that in 8 of the last 9 years, they have overpredicted the spring/summer inflow, even when they had a pretty good idea of how much remaining snowpack they had right in front of them...

Yep, as we've seen more and more lately the snowpack is a surprisingly small part of the runoff story! It kind of sets an upper limit at best.

One of the narratives (which probably proves to have some truth to it) is that there have been factors other than the snowpack that are now different than in the past affecting the runoff. Said factors were always present in reality (e.g. how dry the soil and vegetation are, how much dry wind blows in the winter, how much dust ends up on the snowpack) but in the past some were only indirectly included in the modeling. That is to say some specific factors just ended up encoded in a mapping from X snowpack leads to Y runoff without the model actually using a measurement of that factor as an input. As long as those factors didn't vary too much, and didn't vary well outside historical climatology, then all is good and your model perhaps has a bit more variance than it would if you had included those factors directly, but won't necessarily have a bias.

Now if one of those factors starts deviating significantly from history (e.g. snowpack often gets lots more dust than in the past) now you are in trouble. That historical mapping of X snowpack leads to Y runoff is no longer very accurate in a year with a lot of dust on the snow, you get Z runoff instead. Just changing the mapping to be X leads to Z isn't really the right solution because then you'll under predict in the next year where there isn't much dust. So instead you really should include dust in the model, which of course also means figuring out a way to actually measure how much dust is on the snowpack and then figure out how much that dust impacts runoff based on its relationship with solar load and temperature and dew point and so forth...

These folks clearly have a really hard job!

Also, to be clear, the various example factors I gave above are just examples and I assume are an extremely gross simplification! I really don't know what all is included and which things might have changed and which are critical for that April forecast as opposed to say a January forecast. But in various articles written by the CBRFC they talk about a bunch of this stuff and their work in trying to get more data, include it in the model, and validate that it actually helps the model. Their retrospective reports evaluating their forecasts are really good and interesting!
I’d say that’s a pretty cogent and spot-on analysis of the situation…thank you…

Plus there are a lot of feedback loops that might complicate predictions… anything that reduces the albedo (reflectivity) of the ground, for example, is going to cause more heat to be absorbed, which in turn melts snow. That could be less snow in the first place, or wind-driven dust, or just higher air temps that lead to an early melt, and all of that likely kicks up higher evaporation, or contributes to drying soils that absorb moisture.

Yes, prognostication is a hard job indeed…
 
My main concern as usual is the ramps. I’ve thought for a while that we will be below minimum for launching up north for a period of time in 2026.

So my question is when is it likely we will drop below 3525? And when will we be back above it?

I’m thinking mid February for the below. No idea on the back above.

How low can we go before they HAVE to move Bullfrog?
If all goes according to BOR's predictions, it drops below 3525 in mid-February, and rises above it again in mid-May...
 
How far above will it allegedly be? Gotta leave some margin for error in their optimistic rounding.

Well, they already provide a margin of error and in their “minimum probable” after crossing below 3525 in January it never rises above 3525 for the next two years.

Bottom line, predictions for roughly when we cross below 3525 this winter can be reasonably accurate because there isn’t much variation in inflow between now and then. When, or if, we cross back above depends on spring runoff which is entirely unknown at this point and has huge variation. So pretty much ignore predictions about getting back above - no one, including BOR, has the faintest idea when or even if it will happen at this point.
 
My main concern as usual is the ramps. I’ve thought for a while that we will be below minimum for launching up north for a period of time in 2026.

So my question is when is it likely we will drop below 3525? And when will we be back above it?

I’m thinking mid February for the below. No idea on the back above.

How low can we go before they HAVE to move Bullfrog?
3525 is the cutoff for standard boats at Bullfrog but houseboats are a different story. We talked with offshore last week and they won’t launch or retrieve our houseboat (70’ Hansen style) below 3535. We’ve got some major maintenance that needs to be done out of water this offseason so trying to figure out if we can get the work done before December to get it back in the water before the water levels drop to much. Otherwise we might be waiting til June or July to launch the boat. It could be a really rough year for those that don’t realize what water levels will be doing.
 
Well, they already provide a margin of error and in their “minimum probable” after crossing below 3525 in January it never rises above 3525 for the next two years.

Bottom line, predictions for roughly when we cross below 3525 this winter can be reasonably accurate because there isn’t much variation in inflow between now and then. When, or if, we cross back above depends on spring runoff which is entirely unknown at this point and has huge variation. So pretty much ignore predictions about getting back above - no one, including BOR, has the faintest idea when or even if it will happen at this point.
It's true that any guess about when the lake might rise back to 3525 is just a guess at this point, but a few things are known. If the lake drops to 3516 (likely, +/-), then its active storage at that time will be about 5.1 maf. To get back to 3525 would mean an active storage of about 5.6 maf. So it's a question of when (or if) the reservoir nets an additional 500,000 af once it hits bottom. When the spring runoff really gets going (if it does), that implies about 30-50,000 cfs inflow and outflow is usually around 10-15,000 cfs. In other words, that translates to a net gain of 40-60 kaf/day during those times. At that rate, it could gain 500 kaf in anywhere from 10 days to 2 weeks if it really starts to get going--pretty quick. (That is, if it gets going... on the other hand, in really big years, inflow can reach 75-100,000 cfs)

BOR right now is assuming the spring runoff for 2026 to be better than this year, but still below average - an unregulated inflow of about 7.6 maf, which is modest at best. That's similar to 2024, better than 2025, but nowhere near as good as 2017, 2019 or 2023. We'll see.
 
Last edited:
Yes, we can definitely run some scenarios and it is a great exercise to run the examples that you've done such a nice job with. If we get down to X it could take this range of time to get back to Y. It is really illustrative to see just how simple the math is using some historical ranges to answer some basic questions about lake levels.

But I also think it is really worth highlighting the range the forecasts give right now in the September 24 month forecast. When will we cross back above 3525?

Maximum Probable: We will never cross below 3525 in the first place anytime through 2027. In fact, we won't ever get below 3540.
Most Probable: We will cross back above sometime in May (having crossed below sometime in February).
Minimum Probable: We will never cross back above 3525 anytime through 2027 (having crossed below sometime in February).

I probably sound like an annoying broken record at this point! But there seem to be frequent posts of "why is BOR getting this wrong?" so I'm always trying to hammer home that BOR actually gives us a range of outcomes. Right now, as the stars (or clouds) have aligned, we are in the illustrative condition that the forecasts essentially tell us nothing about this critical elevation of 3525 in the coming spring.

That's worth pausing to reflect on. The seemingly simple question of "when will we cross back above 3525 this coming spring" does not even make logical sense for two of the three forecasts provided by the BOR. In one case we never cross below, in the other we never cross above...
 
Back
Top